News Banner Background
How Statsig scaled to a $1 billion valuation with a one-person finance team​​​​‌‍​‍​‍‌‍‌​‍‌‍‍‌‌‍‌‌‍‍‌‌‍‍​‍​‍​‍‍​‍​‍‌​‌‍​‌‌‍‍‌‍‍‌‌‌​‌‍‌​‍‍‌‍‍‌‌‍​‍​‍​‍​​‍​‍‌‍‍​‌​‍‌‍‌‌‌‍‌‍​‍​‍​‍‍​‍​‍‌‍‍​‌‌​‌‌​‌​​‌​​‍‍​‍​‍‌‌​‌‍​‌‌‍​‍‌​​‍‍‌​‌‍​‌‌‍‍‌‍‍‌‌‌​‌‍‌​‍‍‌​‌‌​‌‌‌‌‍‌​‌‍‍‌‌‍​‍‌‍‍‌‌‍‍‌‌​‌‍‌‌‌‍‍‌‌​​‍‌‍‌‌‌‍‌​‌‍‍‌‌‌​​‍‌‍‌‌‍‌‍‌​‌‍‌‌​‌‌​​‌​‍‌‍‌‌‌​‌‍‌‌‌‍‍‌‌​‌‍​‌‌‌​‌‍‍‌‌‍‌‍‍​‍‌‍‍‌‌‍‌​​‌​‍‌‌‍‌‌‌‍​‌‍​‌‌‍​‌​‌‌​‍​​‌‌​‍‌​‌​‌‍‌​​​‌​‌‍​‍‌​‌​‌‍‌​‌‍‌​‌‍​‌​‍‌‌‍​‍​‍‌​​‌‍‌‌​‍‌​‌​‌‍​‍​​‍​‌‍​​‍‌‍‌‌‌‍‌​‌‍‌‍​‍‌‌‍‌‍‌‍‌‌​‌‍​‍‌‌​‌‍‌‌​​‌‍‌‌​‌‌‍​‌‌‌‌​‌‌​‌‍‌‍‌‌‍‌‌‌​‍​‍‌​​‌‍​‌‌‌​‌‍‍​​‌‌‌​‌‍‍‌‌‌​‌‍​‌‍‌‌​‌‍​‍‌‍​‌‌​‌‍‌‌‌‌‌‌‌​‍‌‍​​‌‌‍‍​‌‌​‌‌​‌​​‌​​‍‌‌​​‌​​‌​‍‌‌​​‍‌​‌‍​‍‌‌​​‍‌​‌‍‌‌​‌‍​‌‌‍​‍‌​​‍‍‌​‌‍​‌‌‍‍‌‍‍‌‌‌​‌‍‌​‍‍‌​‌‌​‌‌‌‌‍‌​‌‍‍‌‌‍​‍‌‍‌‍‍‌‌‍‌​​‌​‍‌‌‍‌‌‌‍​‌‍​‌‌‍​‌​‌‌​‍​​‌‌​‍‌​‌​‌‍‌​​​‌​‌‍​‍‌​‌​‌‍‌​‌‍‌​‌‍​‌​‍‌‌‍​‍​‍‌​​‌‍‌‌​‍‌​‌​‌‍​‍​​‍​‌‍​​‍‌‍‌‌‌‍‌​‌‍‌‍​‍‌‌‍‌‍‌‍‌‌​‌‍​‍‌‍‌‌​‌‍‌‌​​‌‍‌‌​‌‌‍​‌‌‌‌​‌‌​‌‍‌‍‌‌‍‌‌‌​‍​‍‌‍‌​​‌‍​‌‌‌​‌‍‍​​‌‌‌​‌‍‍‌‌‌​‌‍​‌‍‌‌​‍‌‍‌​​‌‍‌‌‌​‍‌​‌​​‌‍‌‌‌‍​‌‌​‌‍‍‌‌‌‍‌‍‌‌​‌‌​​‌‌‌‌‍​‍‌‍​‌‍‍‌‌​‌‍‍​‌‍‌‌‌‍‌​​‍​‍‌‌
reporting icon

Reporting

Revenue insights you can act on immediately

From usage trends to payment delays, Tabs turns your revenue data into predictive insights that drive smarter decisions.

Cursor LogoStatsigcortex2xTennr LogoMavenAGIInspiren
Why Tabs

Why Tabs?

From tactical workflows to strategic planning, Tabs reporting gives you the full picture.

See the story at
every level

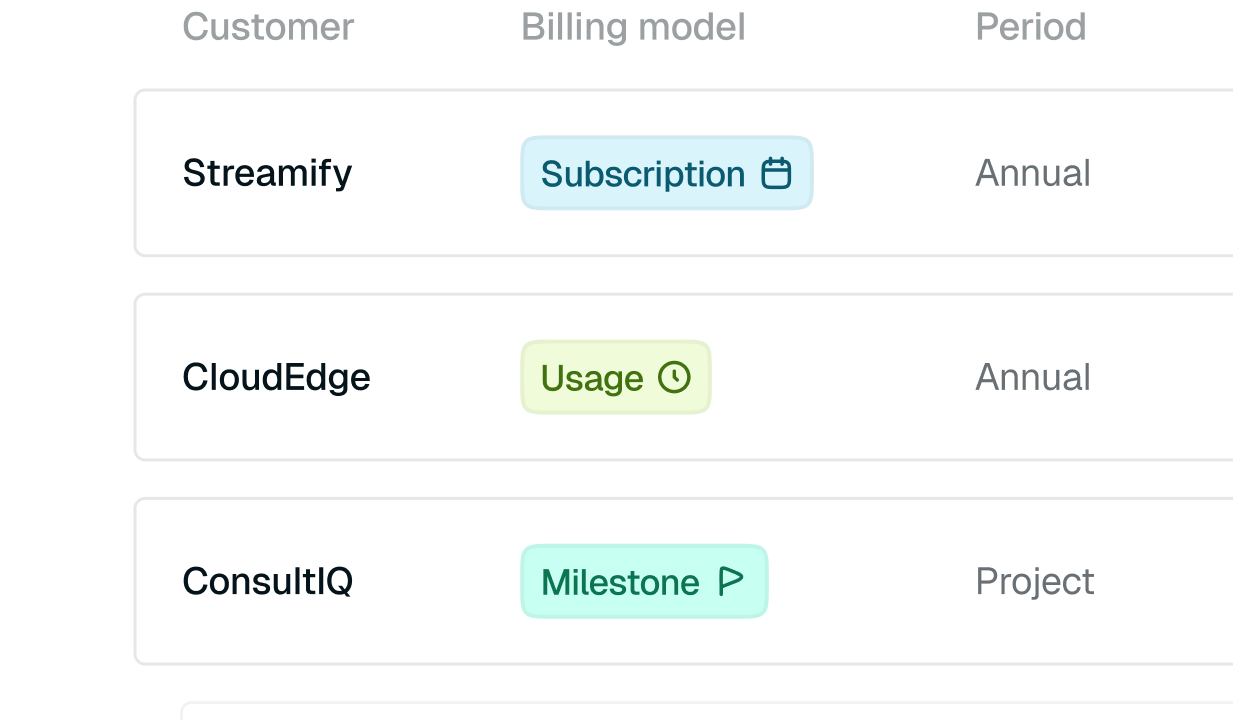
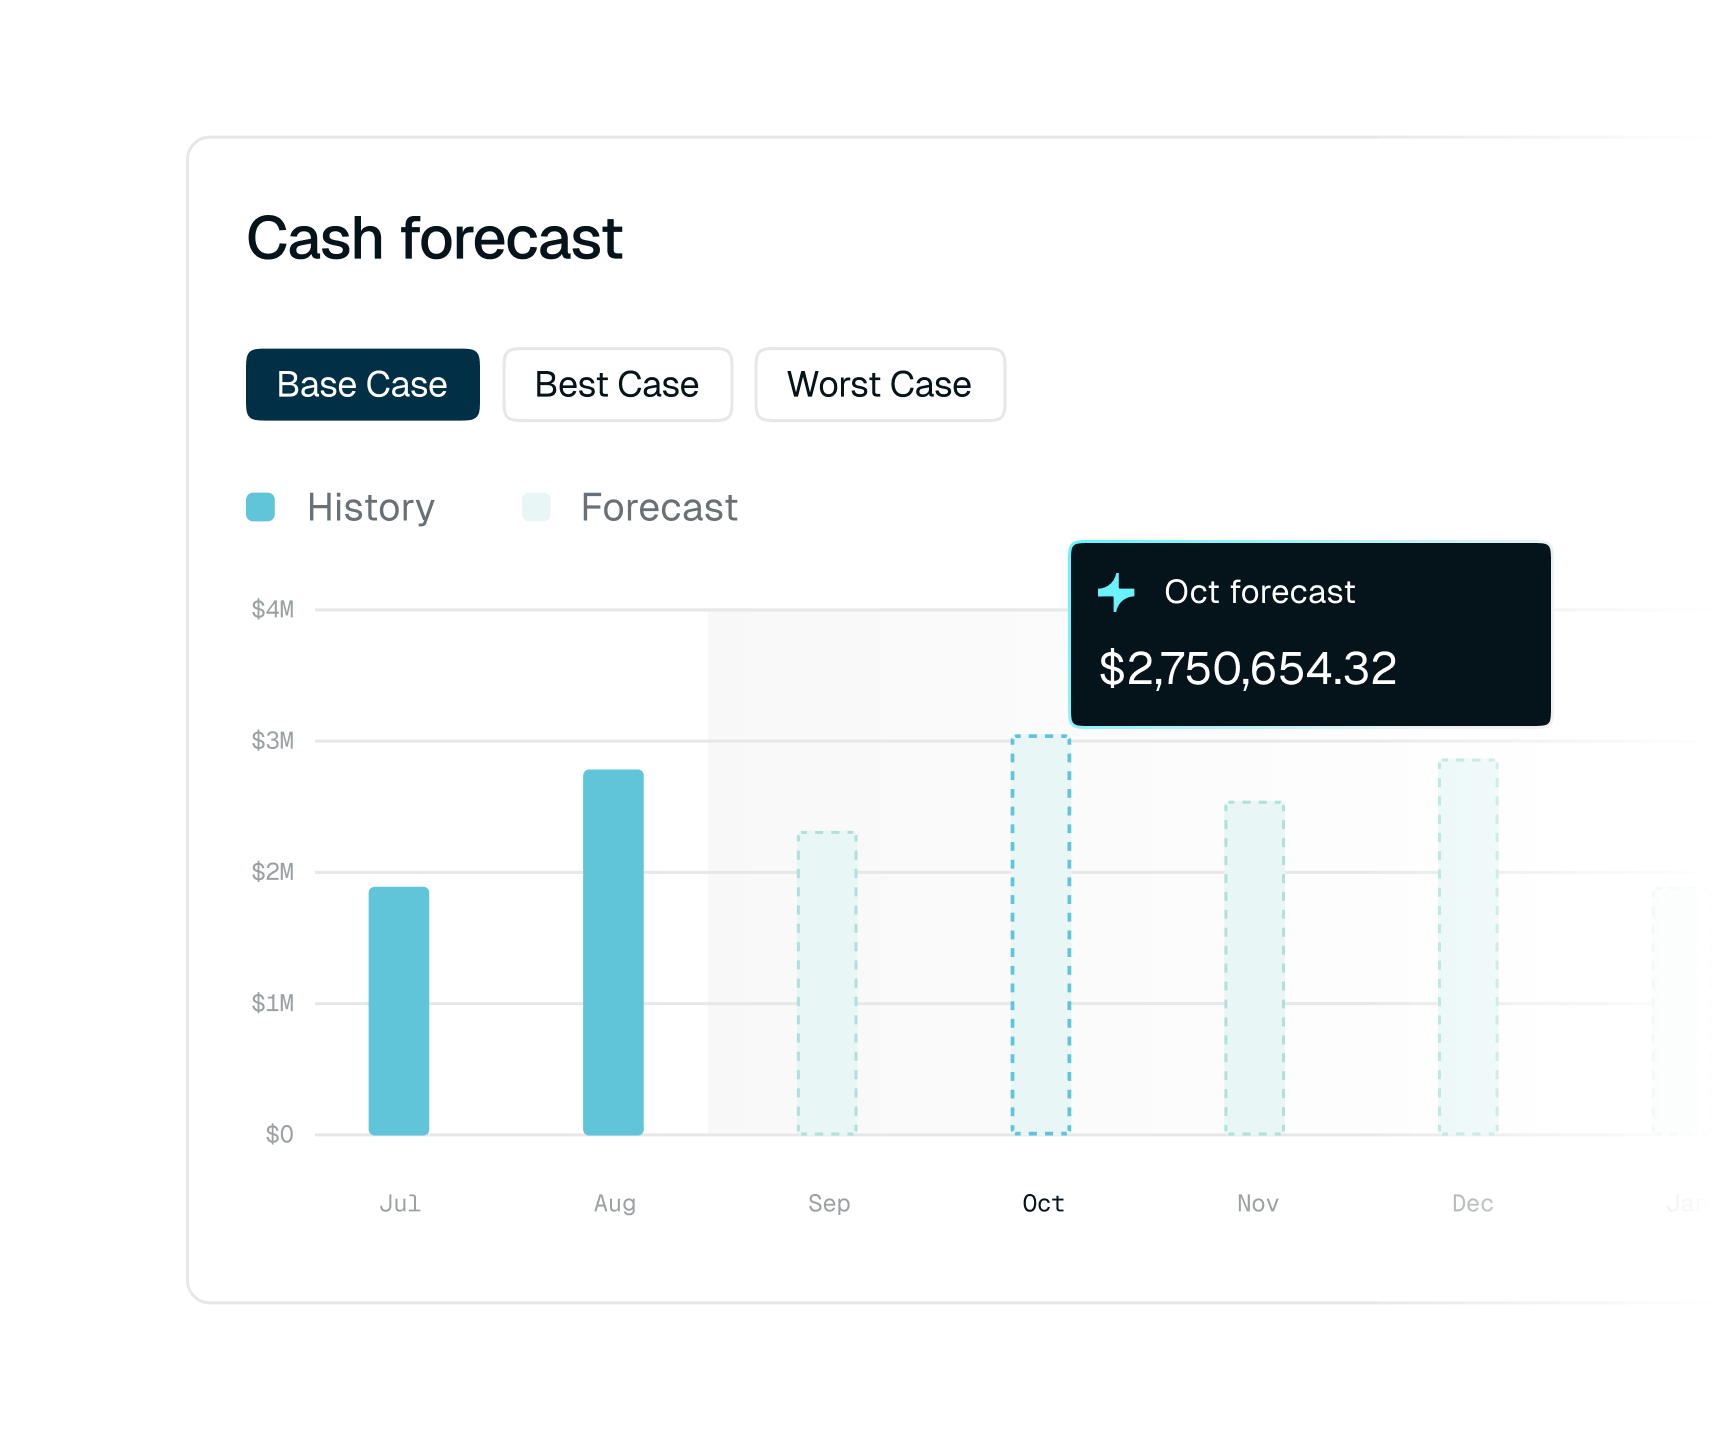
Predict cash with confidence

Build accurate cash flow models from real invoice, collection, and payment data.

9343
3
1890
0
%
more invoices without new hires
Turn insights into action

Turn insights into action

Spot collection inefficiencies, identify at-risk accounts, and reduce DSO with data you can act on.

4723
3
-
1045
5
x
faster invoicing
The story at every level

See the story at every level

From SKU-level metrics to executive dashboards, Tabs balances daily workflows with high-level reporting.

9451
1
2980
0
2500
0
%
of invoices generated on time
a person is typing on a laptop computer in a black and white photo .
airops logo
Where I was spending my time in Stripe and spreadsheets has now fully shifted to monitoring ARR waterfall, collections, and forecasting. I’m now focusing more of my time on our strategic vision and what’s next for the business.
Aayush Daftari, Head of Finance & Operations
5418
8
7580
0
%
stat label goes here
6714
4
x
stat label goes here

Features

The reports you need, powered by real-time revenue intelligence

calendar
Predictive cash flow forecasting

Forecast future cash with confidence

Build accurate cash flow models from real invoice, collection, and payment data.

Predict cash inflows from customer behavior
Identify timing gaps between billing/payment
Plan with rolling, real-time forecasts
image
calendar
Renewals AI

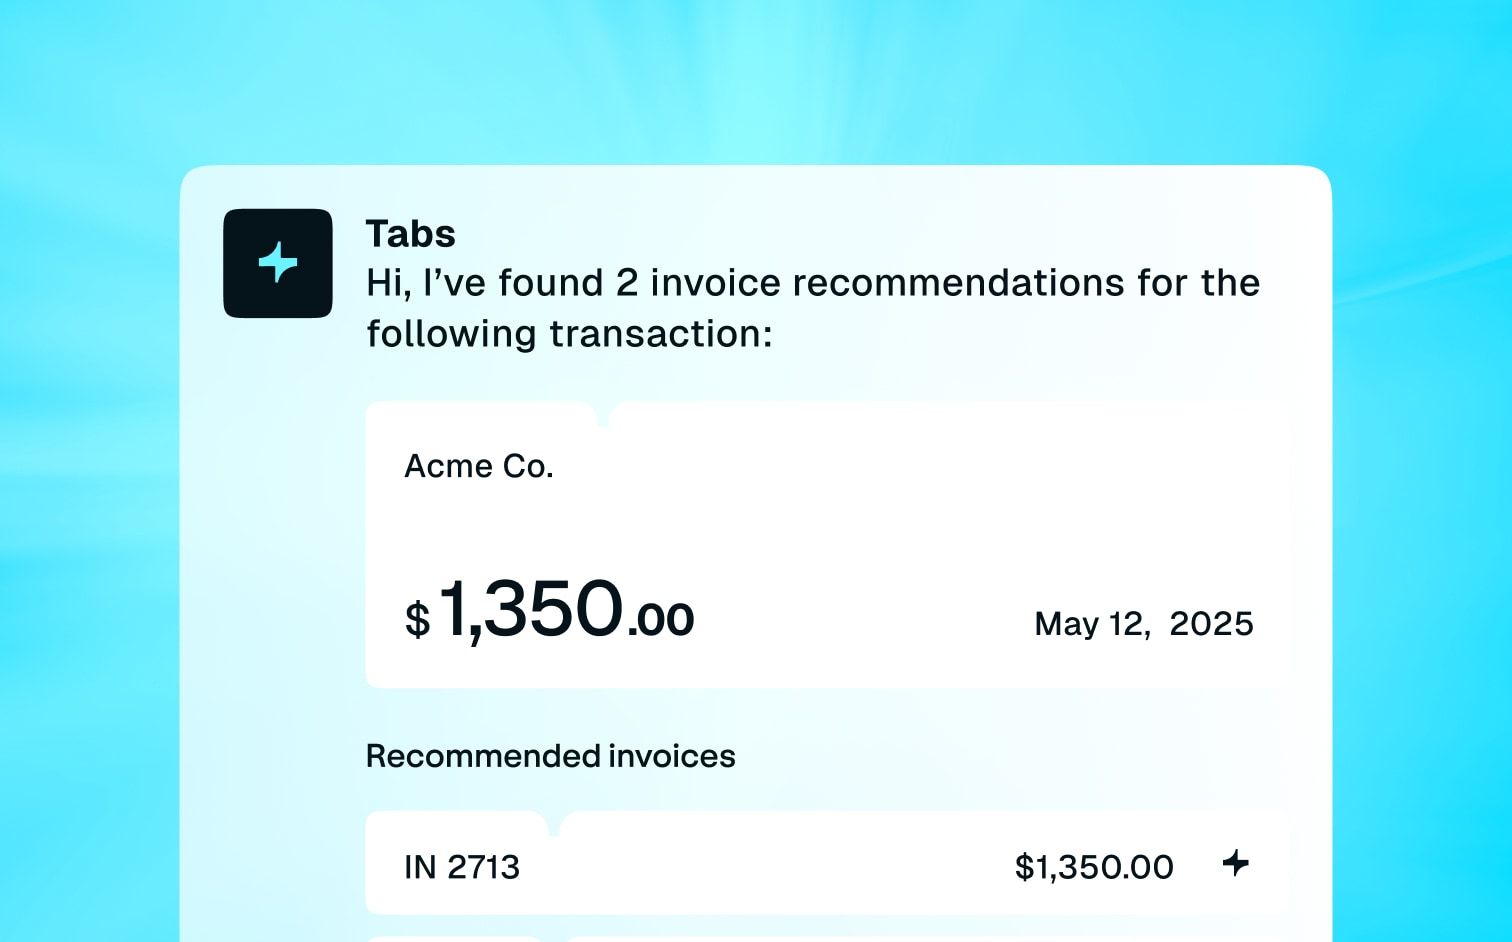
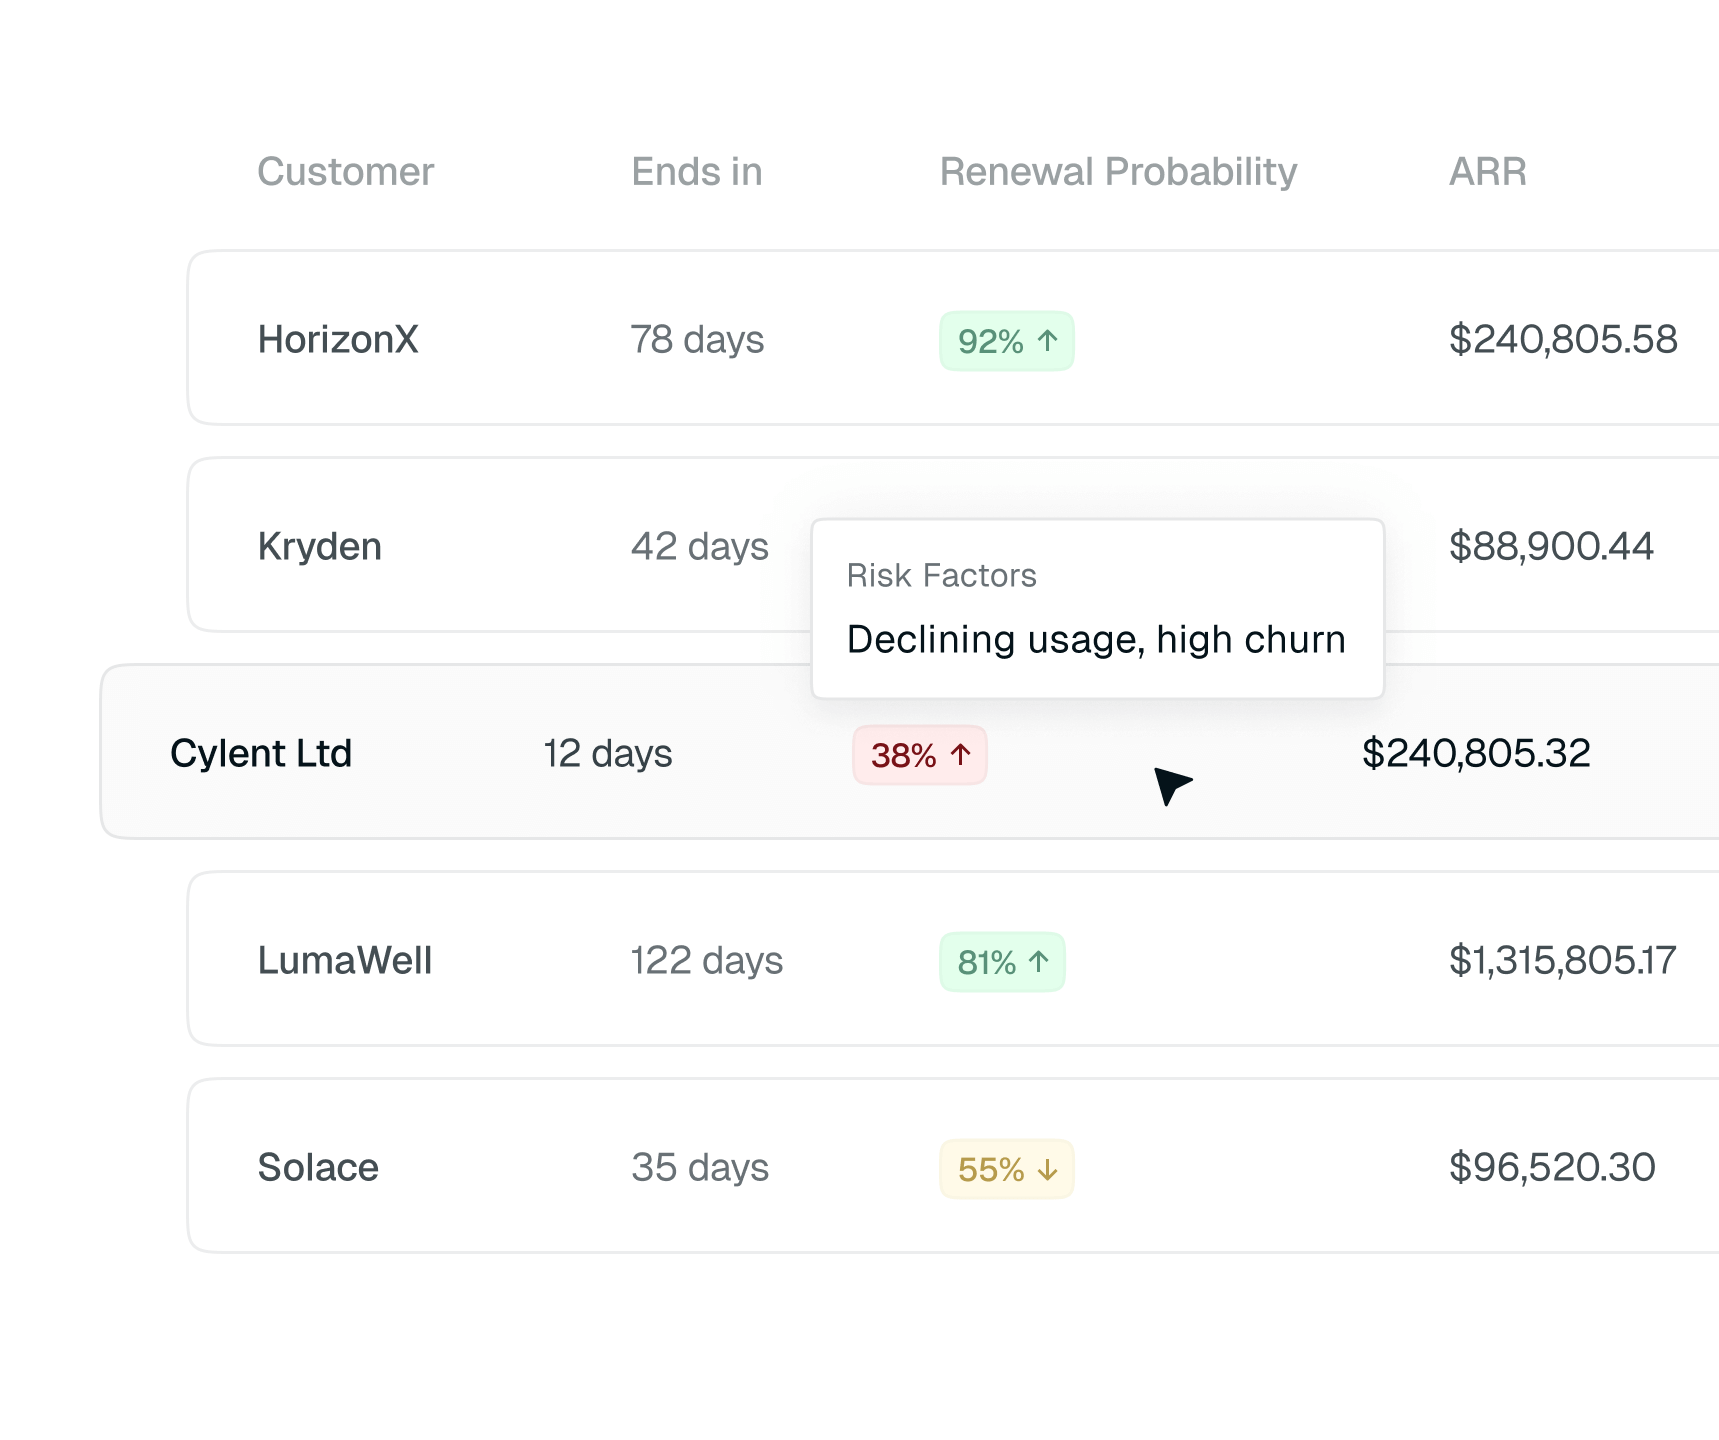
Predict churn and forecast renewals

Tabs uses contract and payment behavior data to surface renewal risk, helping RevOps and finance teams stay proactive. 

Flag at-risk renewals early
Surface uplift and auto-renew terms
Align teams around renewal timelines
image
calendar
Excel export

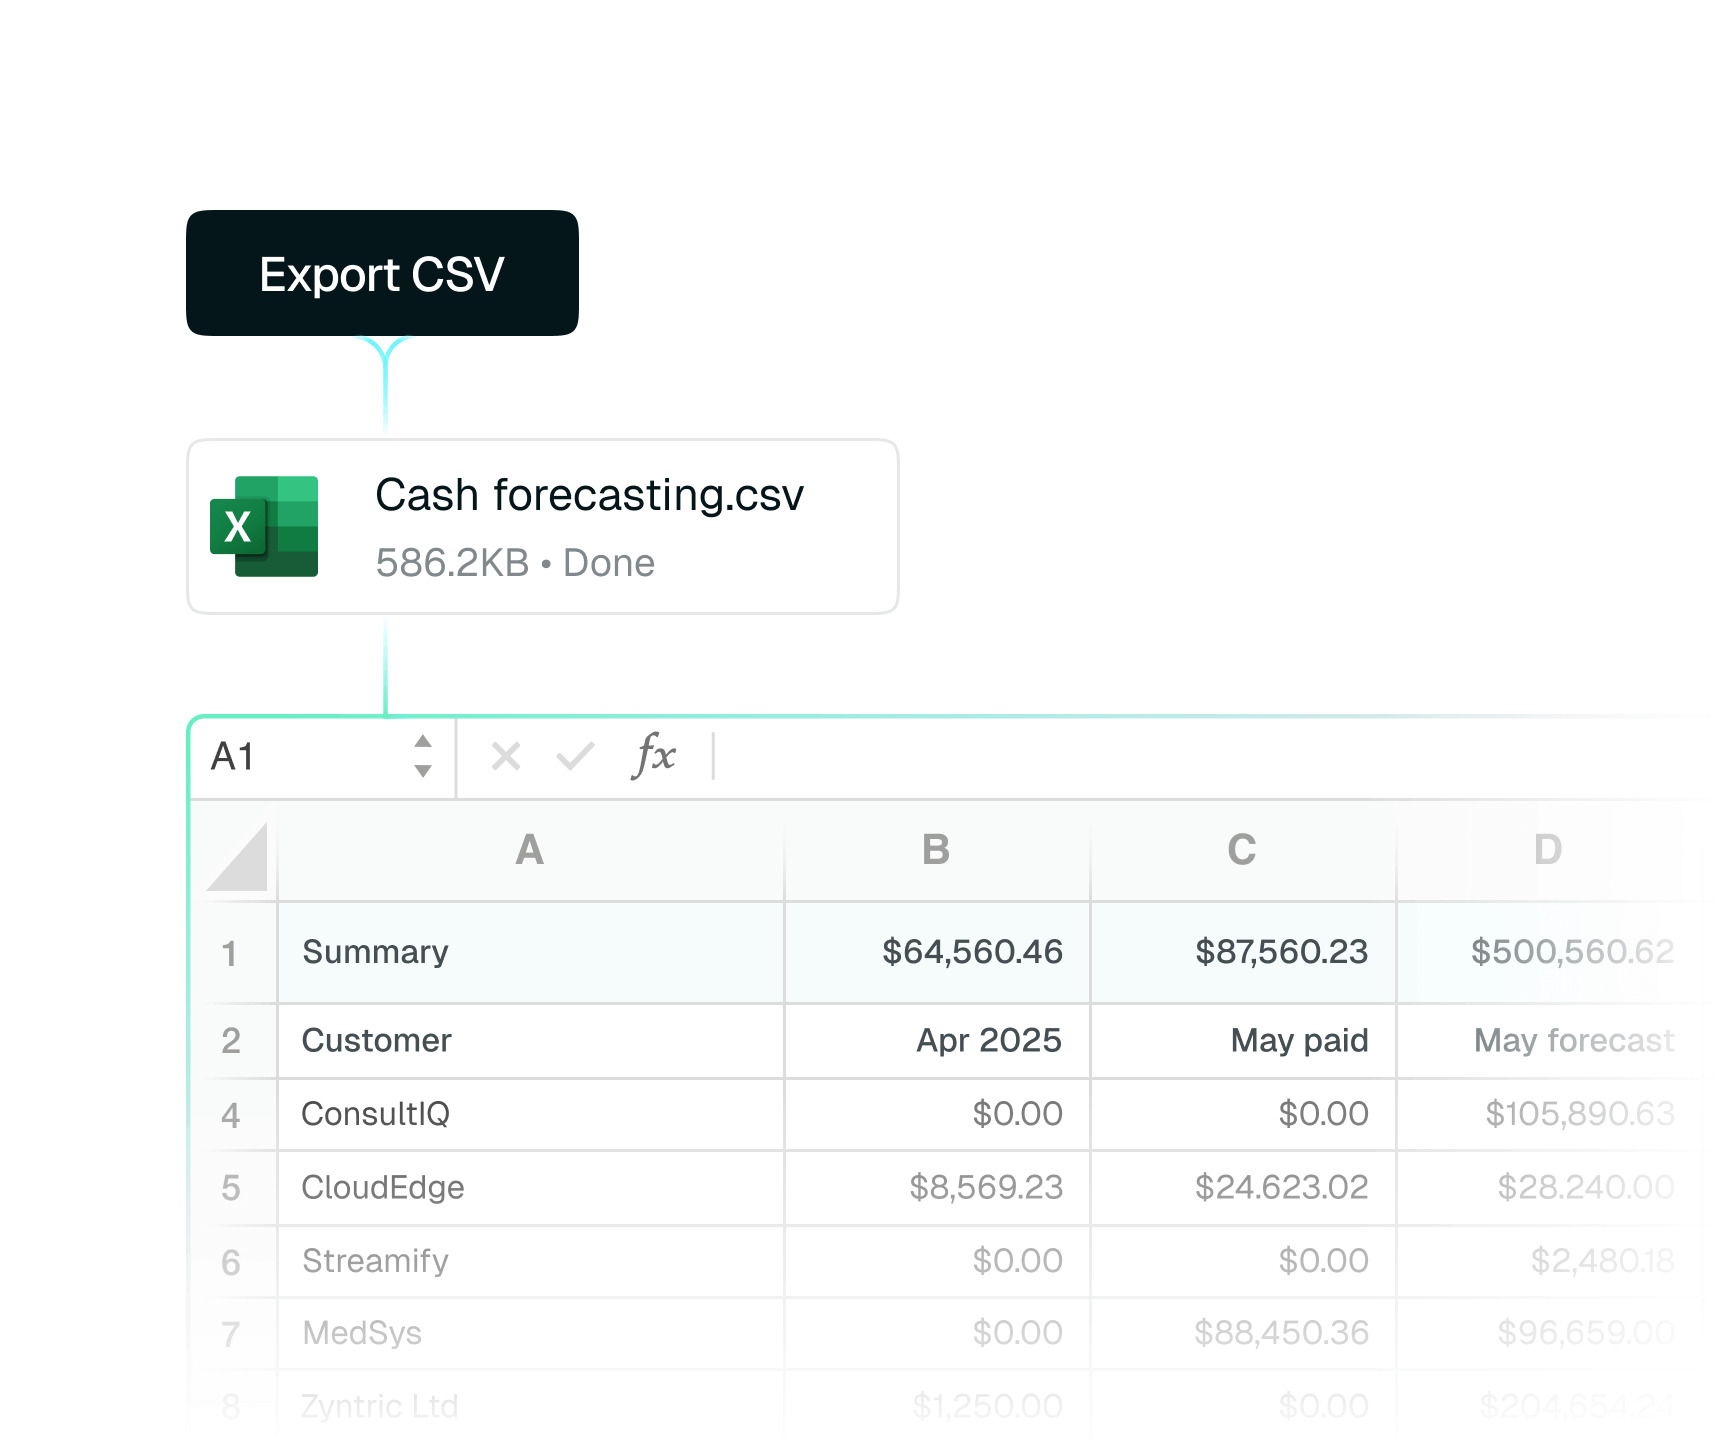
Flexible exports with data integrity

Easily share insights with stakeholders or run ad hoc analyses, all while maintaining ties to the original data source. 

One-click export to Excel 
Keep formulas and tables intact
Share clean, structured reports 
image
Customer-level AR analytics

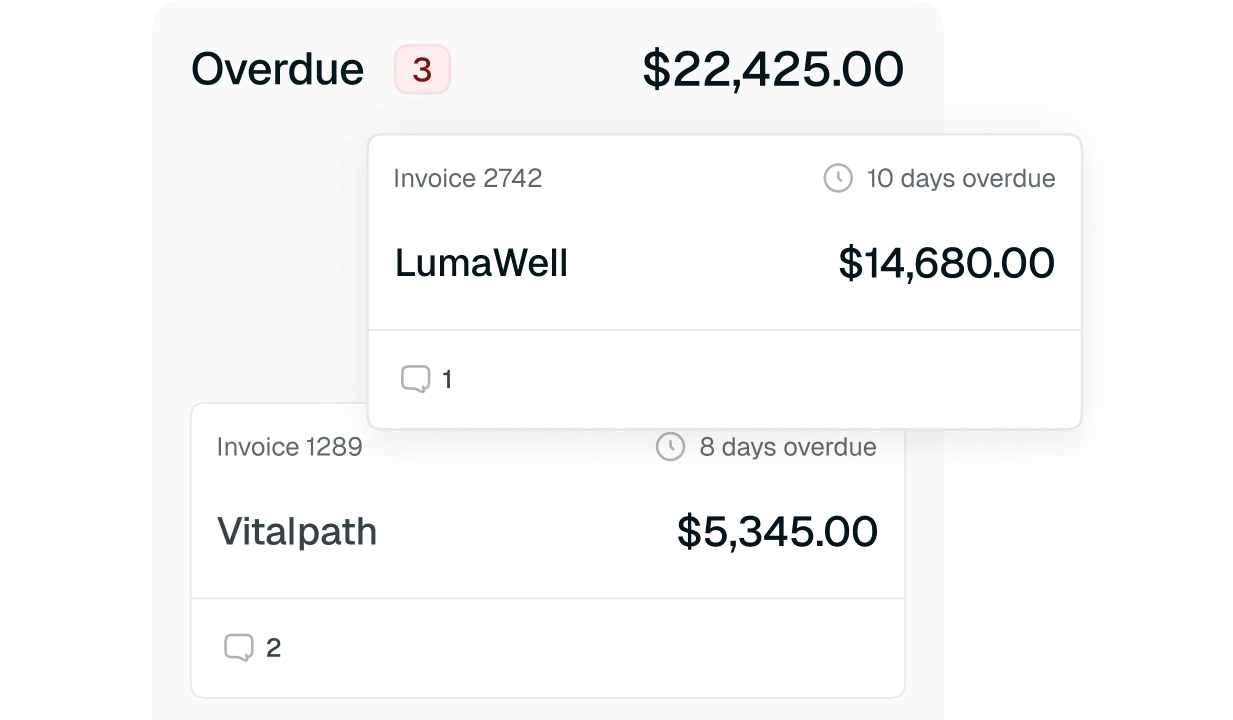
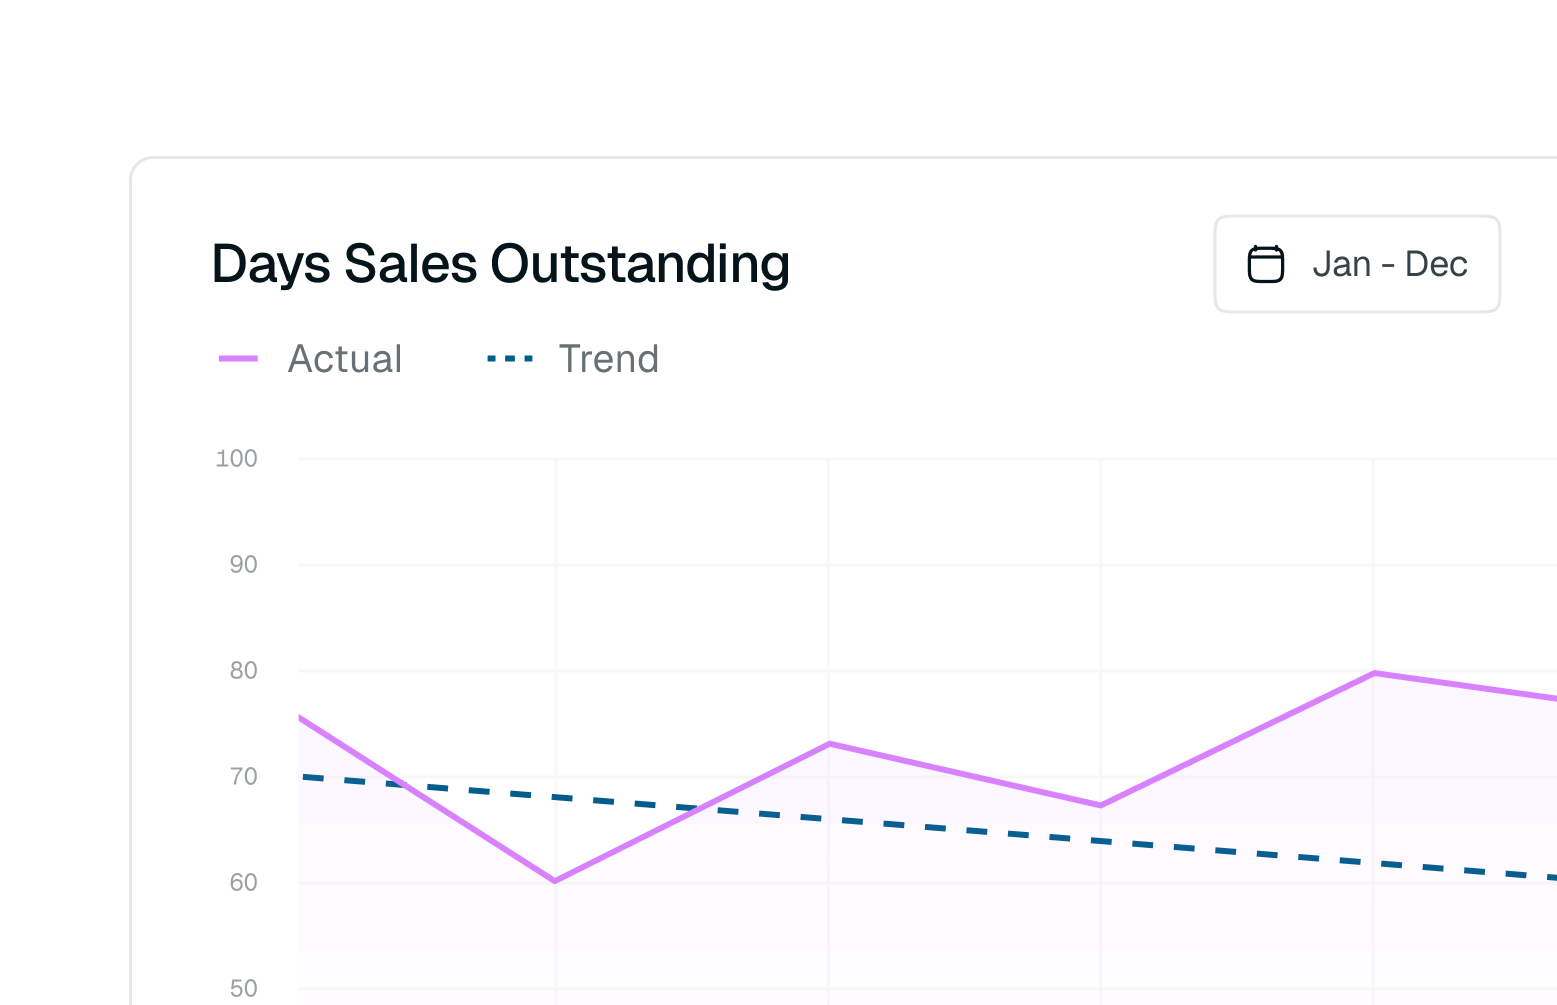
Spot trends and improve collections

Track customer payment habits, identify at-risk accounts, and monitor DSO at the account level to guide smarter collection strategies.

image
Executive dashboards

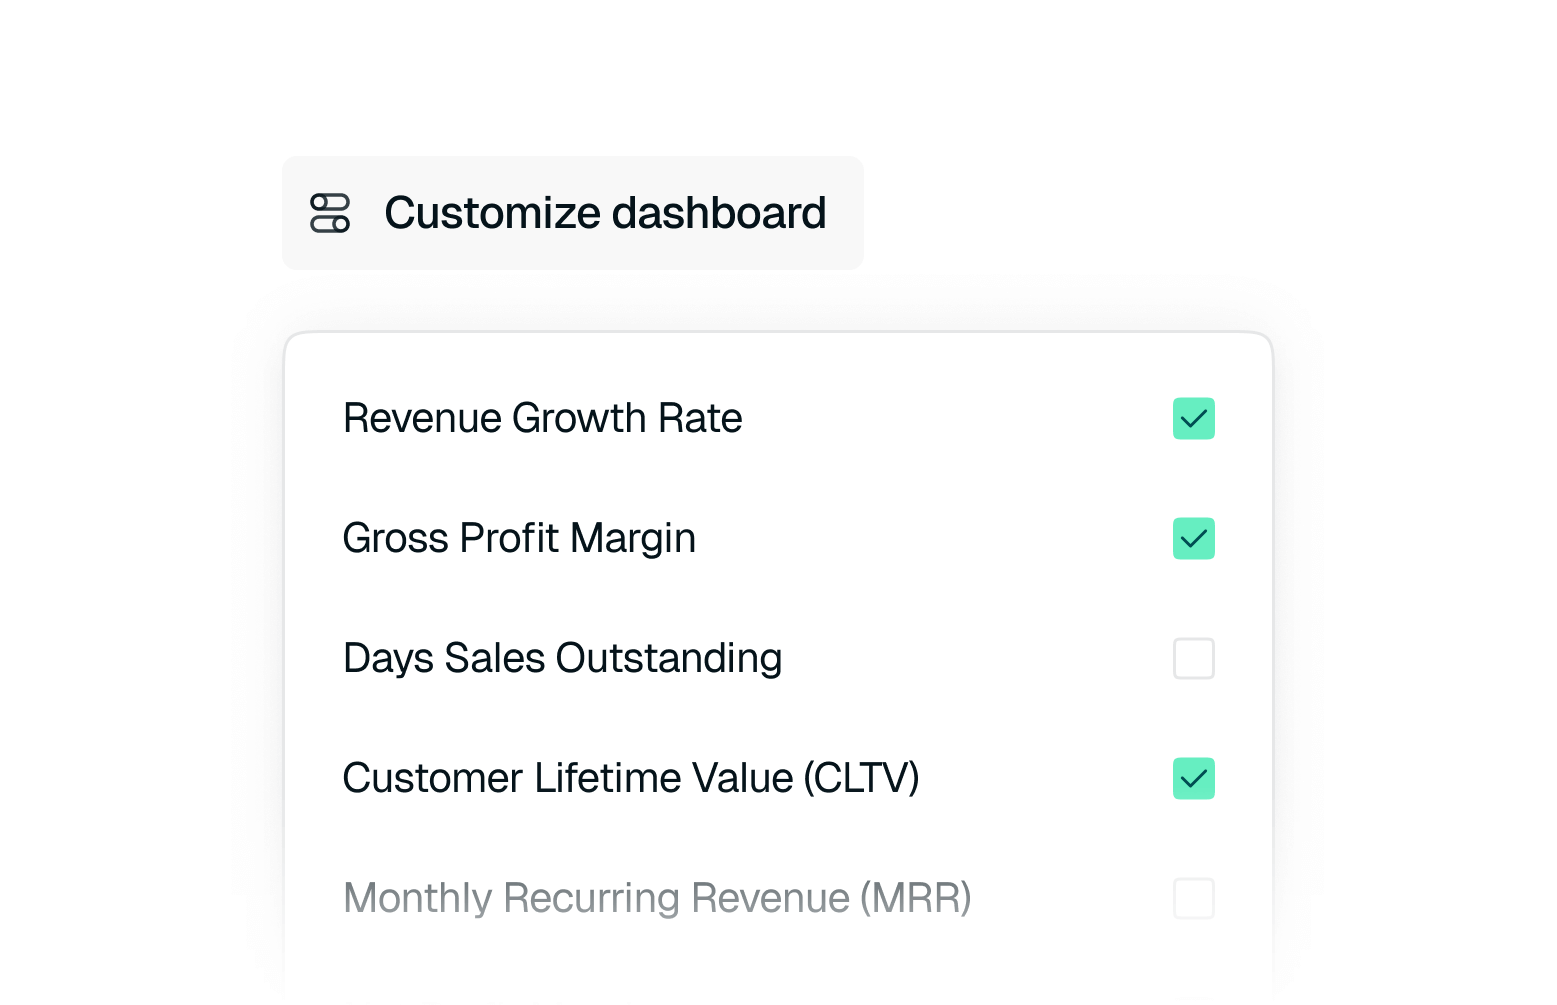
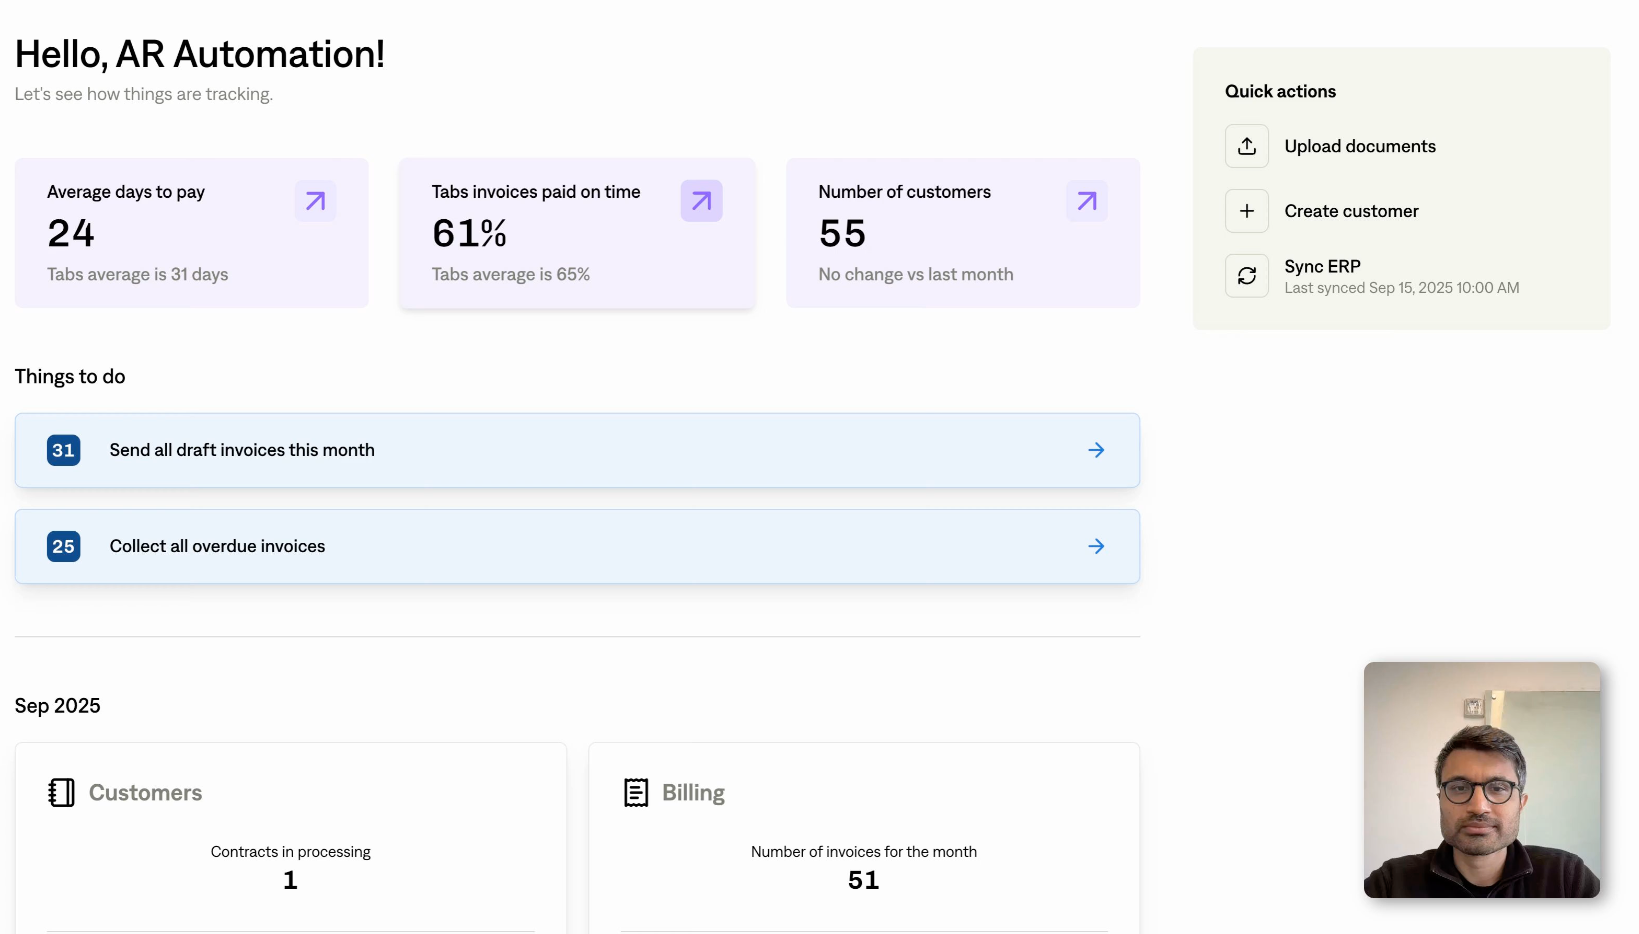
Track revenue KPIs in one place

View high-level metrics like DSO, revenue trends, and payment speed in an intuitive dashboard designed for finance leadership.

image
tabs
cortex logo
How Cortex automated billing and reduced overdue invoices by 50%